

WORKCOMP360 BLOG: See the Bigger Picture with Statewide Lens
Workers compensation data tells a story that extends beyond any individual claim, employer, or carrier. Viewed across an entire state, it can show how the market is changing, where meaningful differences are emerging, and which trends deserve a closer look.
Statewide Lens, available through WorkComp360, gives industry stakeholders an interactive view of Pennsylvania and Delaware workers compensation experience. Users can explore statewide measures over time and examine geographic patterns without beginning with a static report or a predetermined conclusion.
See the Market in Context
A single workers compensation measure rarely tells the whole story.
An increase in average claim severity, for example, becomes more meaningful when viewed alongside changes in claim frequency, premium, payroll, and other measures. Looking across several years can also help users distinguish a short-term movement from a longer-term trend.
Statewide Lens brings these measures together in one interactive view, making it easier to explore how the market has changed over time.
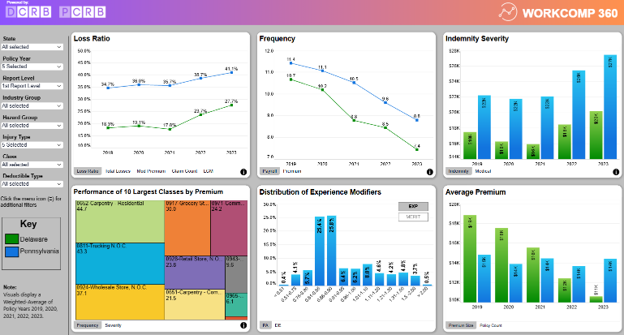
A user might begin with a straightforward question: Are workers compensation claim costs increasing?
That question can lead to a more focused analysis. Is the change being driven by medical or indemnity costs? Has claim frequency changed at the same time? Does the pattern appear across the state or only in certain areas?
By viewing related measures together, users can move beyond an isolated data point and develop a clearer understanding of broader market trends.
Explore Geographic Differences
Statewide results establish an overall picture, but workers compensation experience can vary across different areas of a state.
Statewide Lens includes a geographic view that allows users to explore how key measures vary by region.
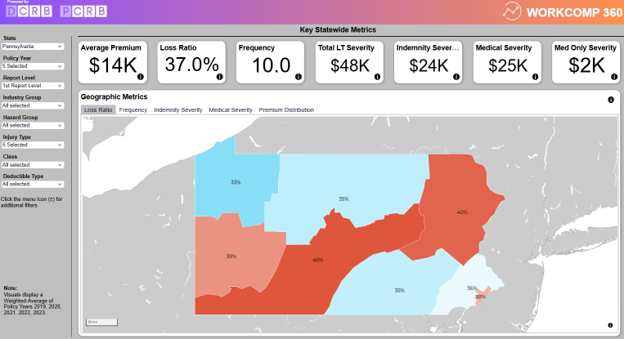
Patterns that are difficult to see in statewide totals may become clearer on a map. Loss ratio, claim frequency, severity, and premium can differ from one region to another.
Those differences do not explain why a pattern exists. They help identify where additional analysis or research may be useful.
If claim frequency is declining statewide but remains relatively high in one region, for example, that observation can become the starting point for a more focused analysis.
Begin Exploring Statewide Lens
Workers compensation information has long been available through reports, filings, and statistical publications. Those resources remain important. Statewide Lens offers another way to engage with the data by allowing users to choose measures, compare periods, and explore geographic differences interactively.
Users can begin with a broad view of Pennsylvania or Delaware workers compensation experience, then follow the trends and measures most relevant to their work.
Statewide Lens does not prescribe a conclusion. It provides accessible data and context that can help carriers, regulators, researchers, and other industry stakeholders identify trends, frame better questions, and support informed decisions. Visit WorkComp360 and open Statewide Lens to begin exploring.